Do you run a business or marketing team? If you do, you know the importance of incorporating data into your everyday operations. Data presents an unbiased, truthful look at the financial health of the company and also provides feedback necessary for potential growth or changes.
Working with data for any amount of time might have led you to stumble across two words: data visualization.
But what is data visualization, and why is it necessary for your business? Below, we’ll answer these questions and dig into the benefits of transforming your data into a comprehensible visual model.
Keep reading to learn more!
What Is Data Visualization?
Picture this: you open up the software you use to record and store data and see every piece of information. You have information on everything from the number of people who have purchased your products or services to their age breakdowns and any campaigns from which they purchased.
Often, this information seems overwhelming. It might be difficult and time-consuming to parse through every single piece of it and figure out if there are any trends. Yet, companies survive off of data. But how do you translate all of this into something you can look at and understand at a glance?
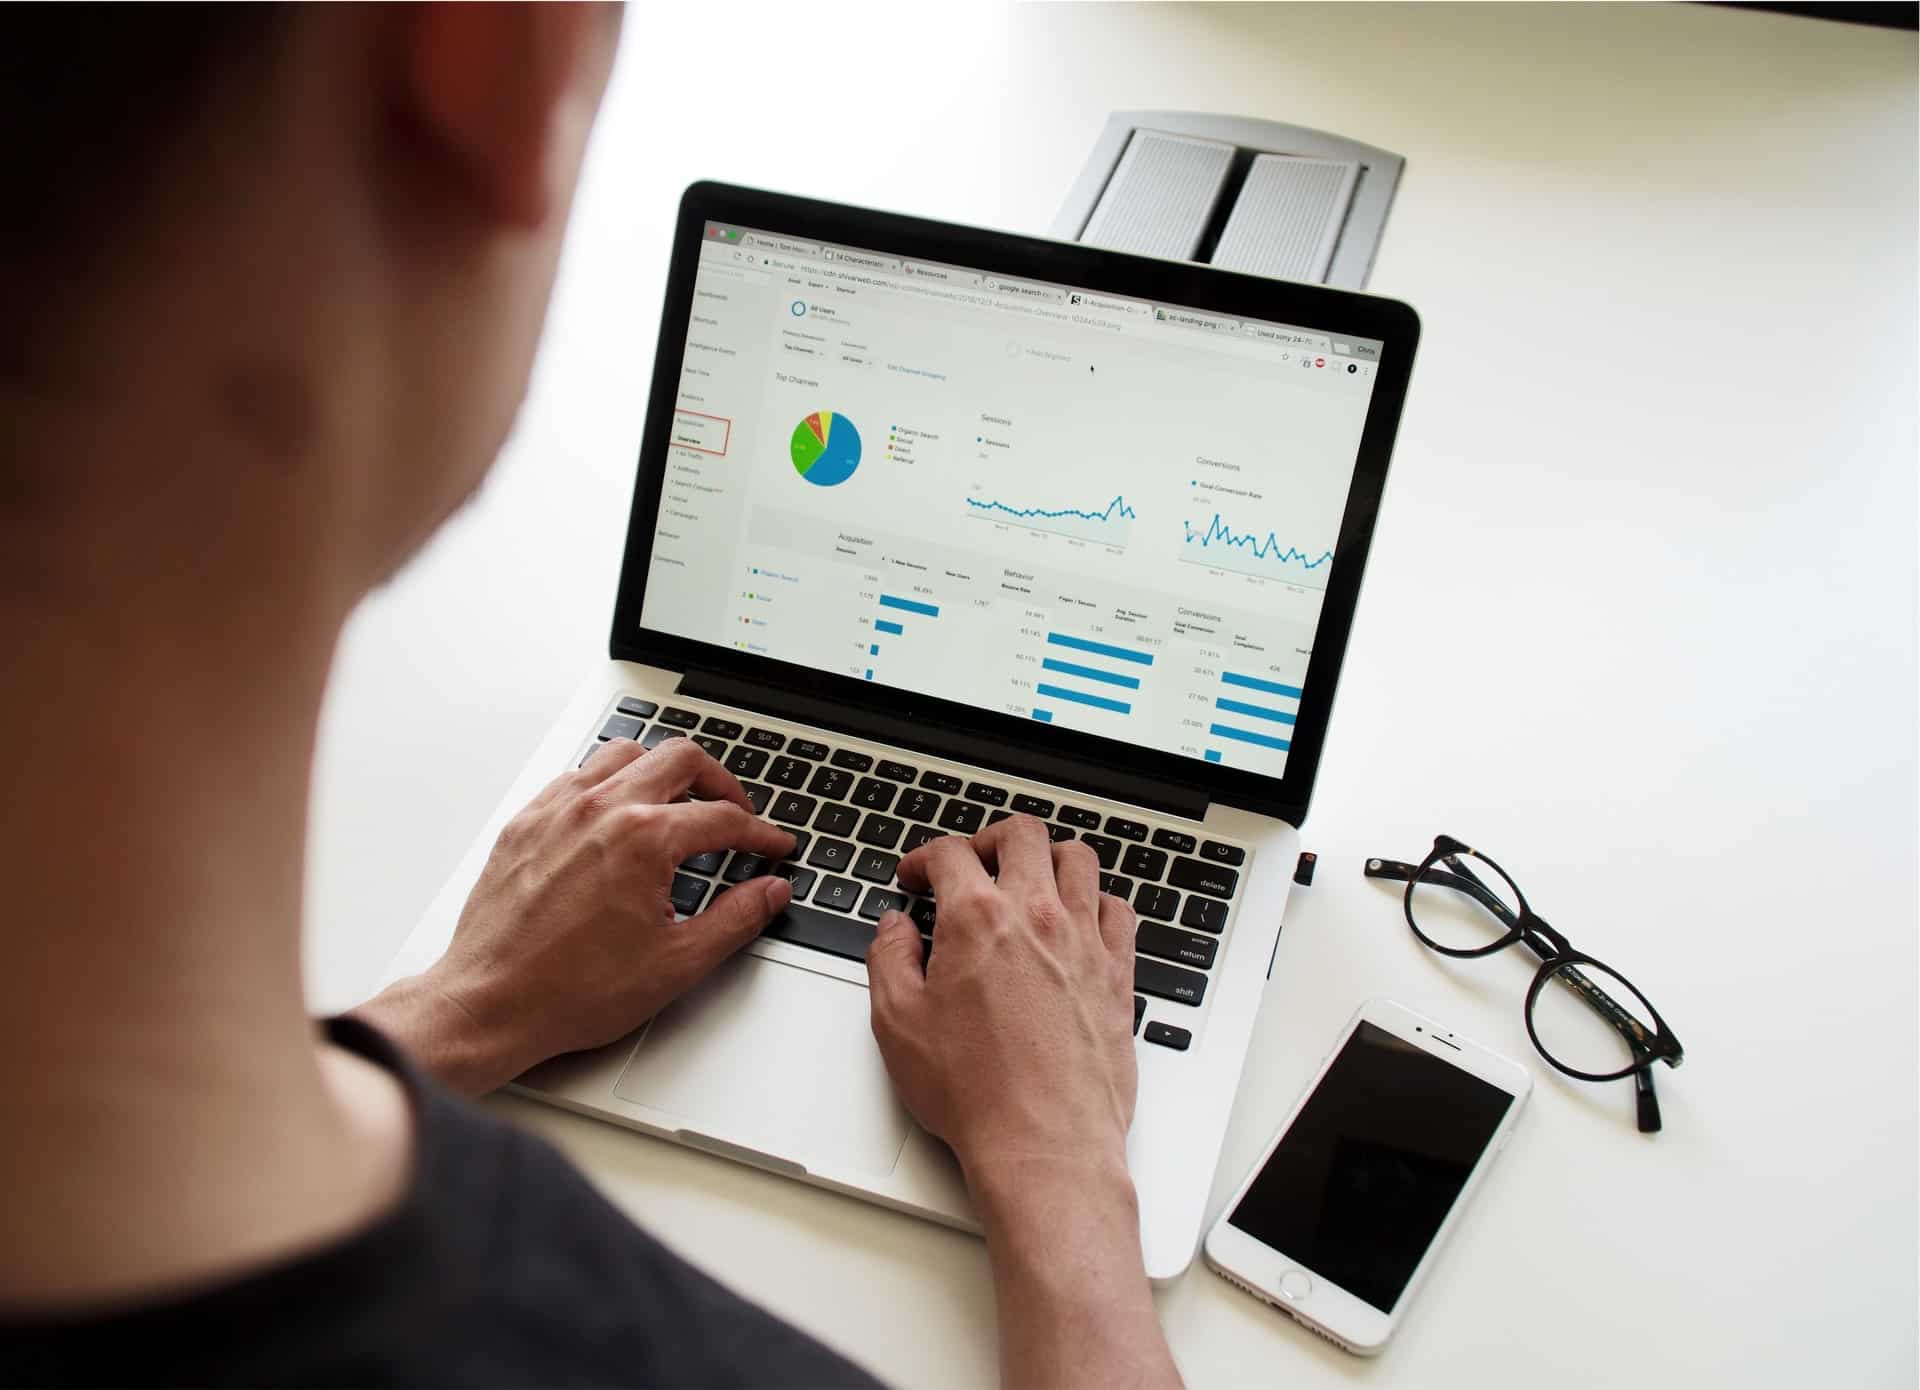
It’s simple! You can use interactive data dashboards for stunning analytics instead of resorting to boring and static reporting.
To do this, you need data visualization. What is data visualization?
It consists of the process by which companies take data and translate it into a model, such as a graph or a chart. Usually, an employee feeds information into a data visualization software, and the platform charts it, which can be extremely useful for even data scraped with a tool like ScraperBox through an enhanced web scraping project. This model can then be used in meetings and as part of decision making.
Why Incorporate Data Visualization?
There are many different reasons to incorporate data visualization into the everyday operations of your company. When you have data visualization, you will be able to quickly and easily consolidate information. This gives you a variety of capabilities and makes the information more easily accessible.
Below, let’s go into how that helps you.
Ease of Interpretation

Do you ever need to present large swaths of data to other people? If you do, you’re probably familiar with the struggle to translate complex concepts into understandable language. After all, you might be able to interpret the data just by looking at it, but other people in your company might not have your expertise in handling this information.
Still, you need to communicate it so they can make proper and wise decisions for the company. Without a proper understanding of the data, they might not be able to guide their teams in the right direction, which can have disastrous effects.
Data visualization simplifies your data and makes it easily understandable. When you construct a model of the gathered information, your colleagues and partners will be able to take a look at it and comprehend the trends in your data. Ultimately, this will then give them the knowledge they need to make important decisions.
Identifying Correlations
Do you want to know one of the most invaluable aspects of data analysis? Identifying the relationship between sets of data.
Usually, in business, different actions taken by a company trigger different outcomes. For instance, if the marketing team from a retail company just launched a sale on leggings, they can then expect more people to buy leggings than usual.
If they do see an increase, the sale worked. If they don’t, they know to study their strategy and figure out what didn’t work.
These correlations provide important information for companies. They show them which tactics work and which do not. Data visualization draws the relationships even more clearly because employees can see the results mapped out in front of them.
Determining Risk

Data visualization tools also help companies determine risk. How does this work?
Whenever a company decides to invest money in doing something new, they’re taking a risk. They don’t know for certain whether or not they’ll get that money back. Yet, businesses must grow and change. If they don’t, they’ll likely go under. Because of this, smart business owners think through the risks they’re taking and only take ones that are most likely to benefit the company.
Data visualization helps them do this. When they have a visual representation of the endeavors their company has undertaken, they can quickly see what has worked and what has not. For instance, if a company is considering sending out a physical newsletter, but data shows that their clients did not sign up for physical mailings, they know spending money on the newsletter might be a big risk.
On the other hand, if they notice their new product selling well, they might decide to produce more items like that product.
Types of Data Visualization
By now, you’re probably wondering what exactly data visualization looks like. As it turns out, different companies map out their information in different ways. The method you use will depend largely on what works best for your business or what suits your personal tastes.
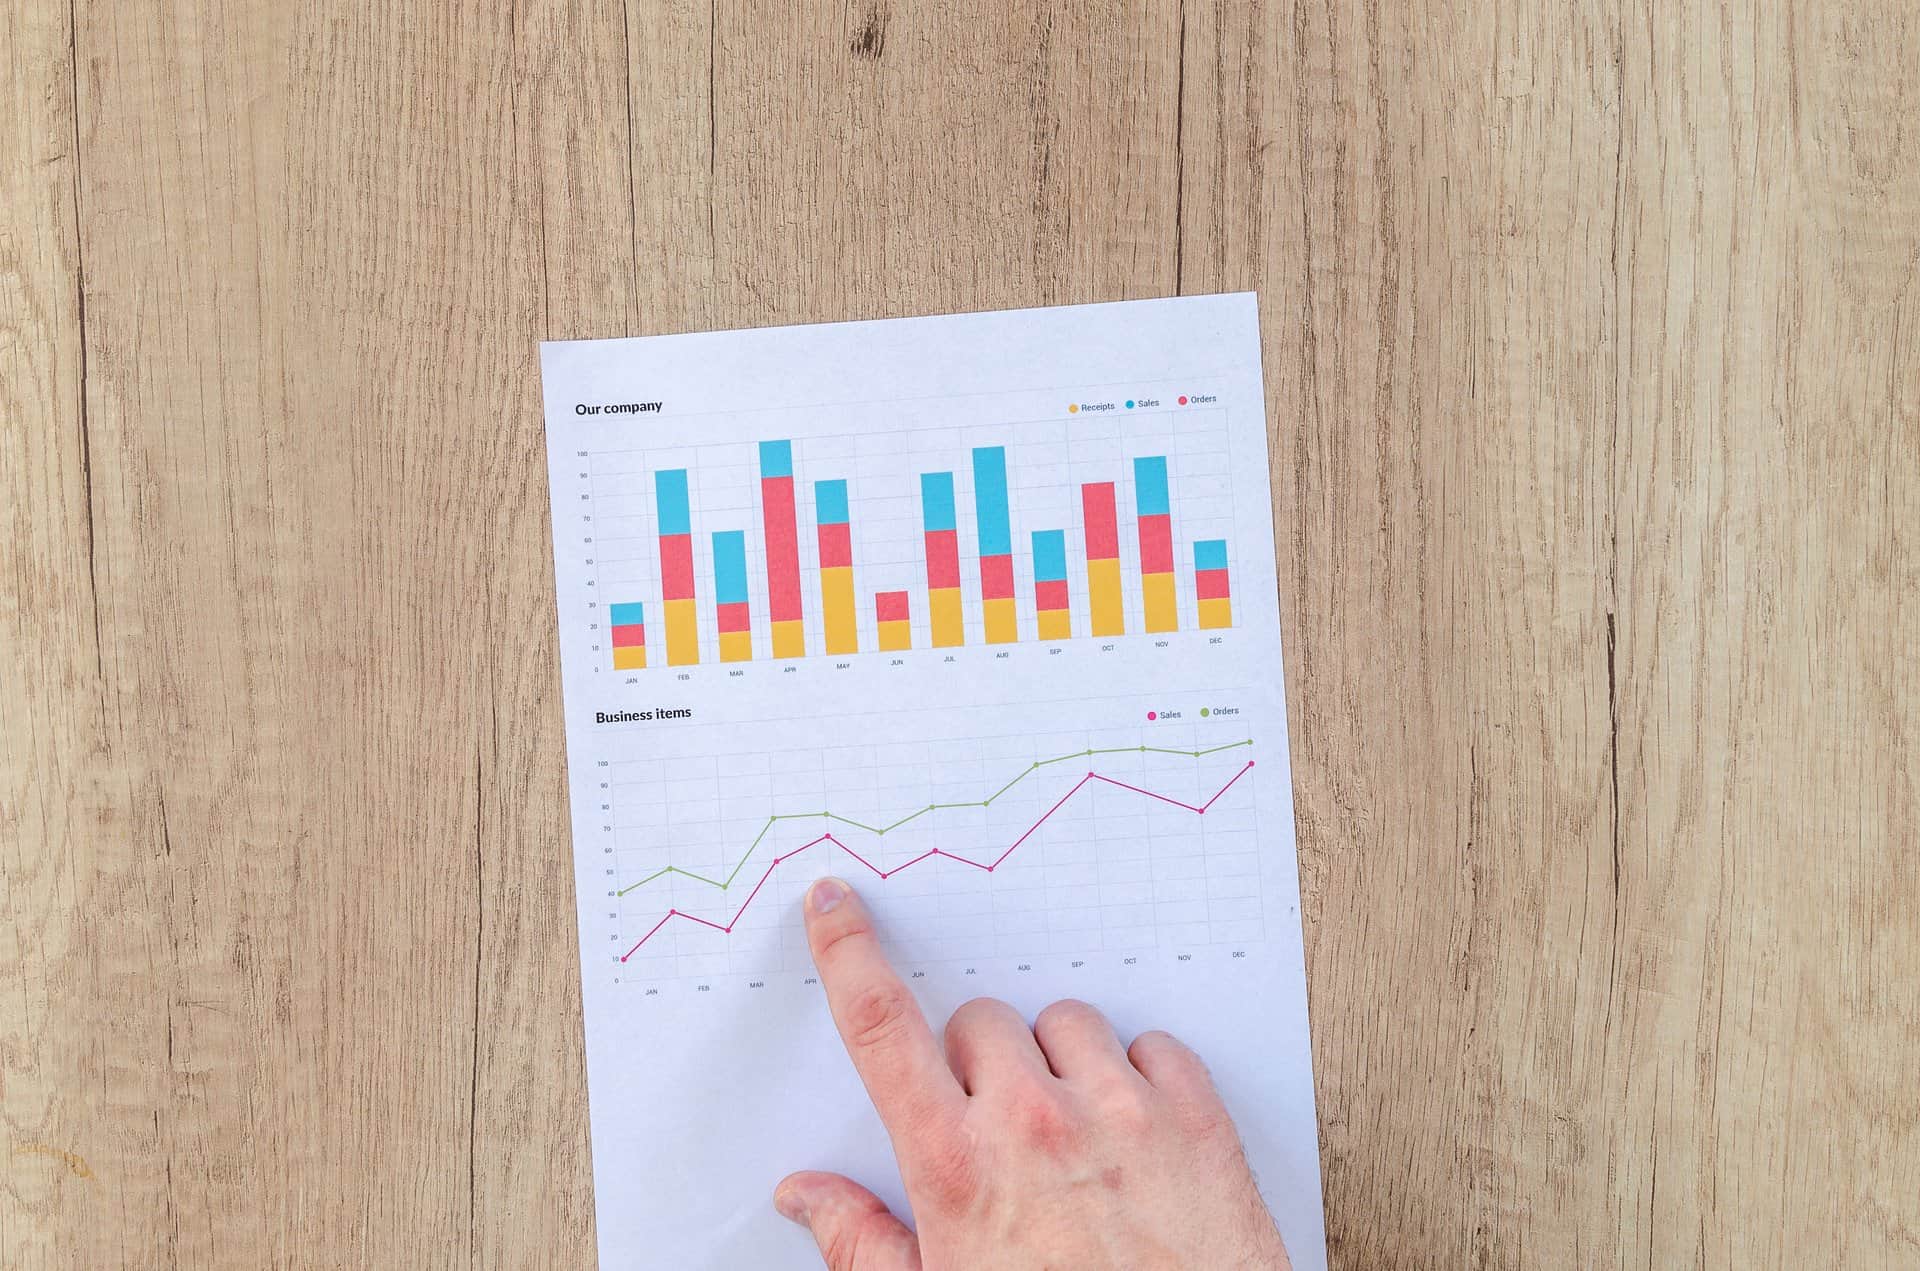
One form of data visualization, the line chart, illustrates changes over time. This can be an effective way to track aspects such as sales over the course of a year. Bar charts also accomplish this.
Scatter plots, on the other hand, note correlations. It plots points along the x and y axes of a chart, showing how different outcomes (y) change based on the trigger (x).
You can also use different software, such as the Rosalind platform here, to create your charts. The software streamlines the data mapping process and churns out easily readable results.
Want to Make Yourself More Effective?
So, what is data visualization?
Data visualization is the means by which businesses turn their data into a visible model. This can be helpful for quickly identifying trends, measuring progress over time, and making decisions.
Because of these benefits, every company should use data visualization.
Is your data visualization model showing your website doesn’t engage as many people as you’d like? We provide webpage templates to make sure you’re reaching your audience. Check them out today!