Hello, dear friend from the 21st century! We’re facing the era of changes where not only new technologies emerge, but also new jobs and professions do. One such new occupation turns out to be a data scientist.
Structuring it, processing, and making a professional and reasonable analysis based on the research is the responsibility that lays on the shoulders of data analysts.
You may have faced a situation where you need to gather and process large amounts of information for essay writing, and it may not be that fascinating as working on a hands-on project. If you don’t want to spend your valuable time on writing papers, turn to essay writing service professionals. Just place an order, and continue working on your target subjects.
In this article, we’re going to point out the main tools every data scientist major should be aware of. Interested? Keep reading.
SAS
If you’re working with large amounts of data, SAS is the right choice for you. It was initially designed for big corporations to process and analyze their statistics and information. It is often used by companies and professionals, operating on reliable commercial software.
SAS uses a specific SAS programming language for handling statistical modeling. It has a large number of statistical libraries and instruments that are used for structuring and organizing information. It is thought to be highly reliable and provides good help from the company.
One disadvantage of this tool may be the price. It is quite costly; that is why it may not be a reasonable choice for small businesses. That is why some modern open-source instruments may become a more practical choice.
Excel
Excel is perhaps, one of the most popular data tools, but at the same time, one of the most underestimated. Within all its features, such as tables, formulae, slicers, and filters, Excel has numerous possibilities, where only your imagination is the limit.
You may create your formulas and functions and adapt all systems to yours so they will work for you. It is also commonly used for visualization, processing, and complex calculations. So, even when one doesn’t require calculations to be done, it turns out to be handy when data visualizations and spreadsheets need to be made.
Since the ToolPak for Microsoft Excel has been created, it became more comfortable to compute complex analysis. Although it is still behind more advanced data science tools like SAS and Power BI, Excel is an ideal instrument on a small level.
Let’s sum up some of the advantages and features of Excel:
- widely used for a small scale of information;
- used for calculation, visualization, and spreadsheets;
- Excel ToolPak enables complex analysis.
Jupyter
Speaking of open-source data tools, the Jupiter project comes in handy. It works with a variety of languages such as Python, Julia, and R. It is an online app that is used for writing live code, presentations, and visualizations. It is a quite popular instrument that was created to meet the needs of data science.
It is an interactive platform where data scientists can accomplish all their responsibilities. It is a great tool for giving presentations; different presentation features are included in it. Jupyter Notebook allows the user to run various functions while operating information. Some of the tasks that can be performed are statistics, sorting out information, different visual tools for creating presentations, and more.
It is completely free of charge and open-source. Furthermore, you may store and operate your information on an online Jupyter service, which is called Collaboratory, simply on Google Drive.
Matplotlib
From the name of the tool, one may conclude that it is a library, which deals with plotting and provides visual instruments. Matplotlib was developed for Python, and it is widely used for creating graphs and analyzing information. It is a popular tool for plotting complex graphs by implementing simple lines and codes. It allows you to generate bar plots, scatterplots, histograms, etc.
Matplotlib includes a number of main modules. One of the most popular is Pyplot. It is also available online in an open-source.
Matplotlib is a widely used instrument for data visualization; it is popular with specialists and holds leading positions on the market. Particularly, NASA applied Matplotlib for illustrating data visualizations during the Phoenix Spacecraft landing. Also, if you’re a beginner in data visualization, this tool will be a perfect choice for you.
Tableau
You need Tableau if you’re looking for a data visualization software. Inside this tool, you will find great templates to create your visual content. Companies that deal with business intelligence choose Tableau. Its uniqueness lies in its capacity for online integration of all your data, including databases. OLAP (Online Analytical Processing) is the platform where you may operate all your information. One of the key features of Tableau is its range of Tableau connectors, which allow seamless data integration from various sources.
Furthermore, it increases your opportunities to work with maps, providing unique tools. Besides visualization, it includes an analytics tool to analyze information. There is a large Tableau community, which actively shares findings among each other online, so you can join and learn together.
ggplot2
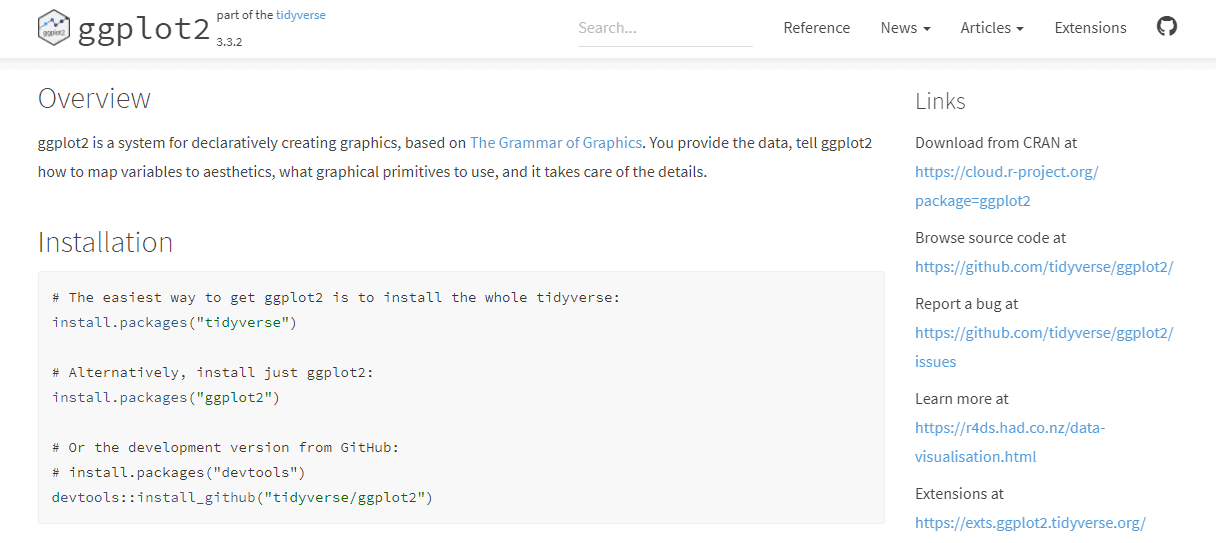
This is a powerful tool, which was developed with improved visualization instruments and is used for R. It was developed to substitute the standard graphics instruments of R and includes great commands to make enhanced visualizations.
The core feature that distinguishes ggplot2 among all other tools is its aesthetics. With this instrument, you will be able to make custom visualizations to improve and engage storytelling.
Using ggplot2, one can annotate information in visualizations, boost accuracy in graphs, and add text labels. You can also use it to create different styles of maps like cartograms, choropleths, and hex bins.
Final Words
Data science requires a number of various tools. Most of them handle data science operations in one place. This simplifies the process for a user to use all functions of data science without writing their code from the beginning.
This list is not full, and there are more tools that you may find to be the best for you. So, first, decide on your aims and then choose the instrument or instruments that will work for you.