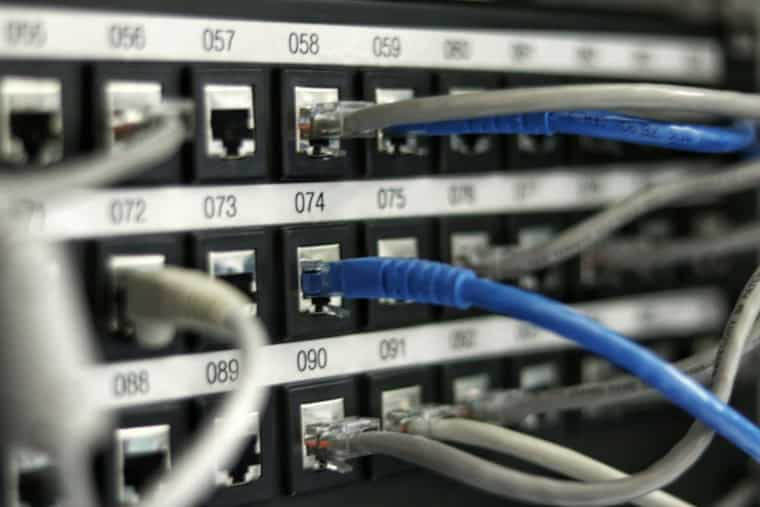
If you’re a network troubleshooter, a sysadmin, or just a Reddit-surfing techie who’s constantly hunting weird latency bugs, you know the struggle. Those random lag spikes. The “everything’s fine except when it’s not” mysteries. You can’t fix what you can’t see, and that’s where packet capture tools come in. Whether you’re tuning your gaming rig, analyzing home network issues, or managing an enterprise grid of doom, the right tools make all the difference.
TL;DR
Wireshark is great, but sometimes it’s bulky. Reddit users often team it with lighter front-ends or alternatives to diagnose latency spikes. This list covers 5 awesome cross-platform tools that help track and analyze network hiccups fast. You’ll get better insight with less stress.
1. Wireshark (The King of Packet Analysis)
Platforms: Windows, macOS, Linux
Wireshark is the gold standard in packet capture and analysis. It digs deep into traffic and decodes dozens of protocols. Tons of Redditors swear by it for tracing spikes and drops in latency.
But let’s be honest: it’s big. And detailed. Which is both a blessing and a curse. Especially if you’re just trying to see what happened behind that 6-second lag on your Discord call.
Cool Features:
- Live packet capture and offline analysis
- Color-coded traffic filters for easy reading
- Graphing tools to visualize spike timing
This is your main engine. But many Redditors combine it with something simpler on the surface to make life easier.

2. Termshark (Wireshark in Your Terminal)
Platforms: Windows (WSL), Linux, macOS
Want to look cool while tracing spikes in your terminal? Termshark is a text-based TUI (terminal user interface) for reading pcap files. It’s like Wireshark minus the GUI weight. Reddit users love spinning this up for quick reviews on systems with few resources.
Why It’s Awesome:
- Works well over SSH (great for remote servers)
- Displays packet details and flows cleanly
- Filters like Wireshark, but keyboard-driven
One Redditor mentioned running it on a Raspberry Pi that caught brief daily lag spikes in a home automation system. Sleek and nerdy.
3. TShark (Wireshark’s Command-Line Twin)
Platforms: Cross-platform, same as Wireshark
If you don’t need visuals, Wireshark’s command-line twin, TShark, is incredibly lightweight and powerful. Many Reddit users use it to run continuous capture sessions, then analyze the output later or pipe live summaries to logs.
Best Uses:
- Scripted monitoring (cron + log = magic)
- Headless server debugging
- Filtered captures (only what you need)
Combining TShark with custom grep patterns can make spot-checking latency changes incredibly efficient. One Redditor even posted a script that emailed latency graph deltas every hour!
4. CloudShark (Capture Sharing Made Easy)
Platforms: Web-based (All platforms), or on-prem
Sometimes the problem isn’t your network — it’s someone else’s. That’s where CloudShark shines. It’s a place to upload and share packet captures in a beautifully visual interface. Great for remote teams or when your friend insists “their ping is fine.”
Why Redditors Like It:
- Drag-and-drop .pcap files right into browser
- Search and analyze without downloading anything
- Clean graphs and filtering tools built-in
It’s great when you want to collaborate without getting buried in hex dumps. Just make sure you’re not uploading anything with sensitive data unless you’re on the private version.

5. EtherApe (Watch Your Network Come Alive)
Platforms: Linux, macOS (via MacPorts), Windows (via WSL or VM)
This one’s a little different. EtherApe is visual — think network graph that changes in real-time. Every node is a host, and each line represents traffic. Bigger lines? More data. Spikes become very obvious, fast.
Redditor Favorite Use:
- Spy on sudden spikes and map them to IPs
- Visualize bottlenecks and bursts immediately
- Perfect for “Who’s hogging all the Netflix bandwidth?” moments
It doesn’t offer deep packet analysis like Wireshark. But if you want to “see” the troubled moments in a more intuitive way, it’s eye-opening.
Bonus Tips from Redditors
- Use ring buffers with TShark or Wireshark to capture for hours without filling your disk.
- Combine packet capture with ping scripts to get better context around spikes.
- Use filters like: tcp.analysis.ack_rtt, icmp, or tcp.flags.syn==1 to slice through the noise.
- Always match timestamps between the monitoring and the latency event.
And honestly? Sometimes you’ve just got to throw something like ping -n 100 8.8.8.8 into a log file and start correlating. Even the experts on Reddit go old-school when needed.
Final Thoughts
Latency spikes are tricky. They hide. They come and go. But with the right tools — Wireshark and its lighter cousins — you get clarity.
Whether you’re digging deep into TCP headers or just watching who’s slamming BitTorrent at 2 am, these tools help uncover the truth behind the traffic.
And if it still doesn’t make sense after hours of trace reading? Post your .pcap to /r/networking. There’s always someone ready to nerd out and help.